
How to Measure Bubble Size Distribution in Multiphase Flow Systems
Why bubble size distribution drives mass transfer, mixing and separation performance Comparing invasive probes, high-speed imaging and AI-powered characterisation for different flow regimes Turning measured distributions into design and scale-up decisions your team can defend
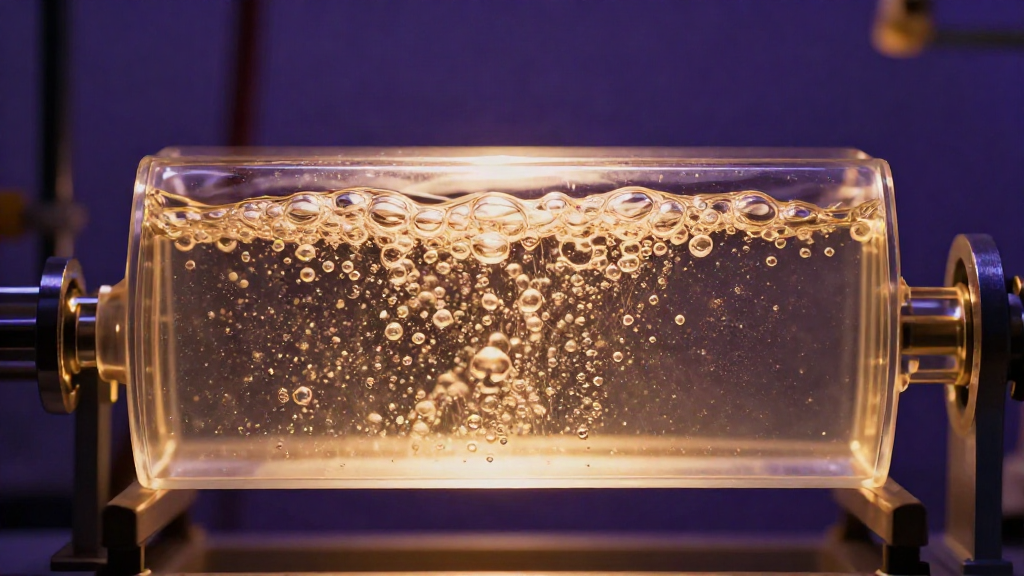
Bubble size is one of the few variables in a multiphase system that quietly decides almost everything else. Interfacial area, mass transfer rate, gas hold-up, mixing intensity, foam behaviour and separation efficiency all hang off the distribution of bubble diameters in your vessel or pipeline. Yet on many plants, bubble size is still an assumed number typed into a model rather than a measurement anyone can defend.
This guide sets out a practical, method-led path to measuring bubble size distribution in multiphase flow systems – from defining the metric you actually need, through matching a technique to your flow regime, to turning the data into design and scale-up decisions.
Why bubble size distribution decides performance
The interfacial area available for gas-liquid transfer scales with the second moment of the bubble size distribution, not with a single average. A stream with the same gas hold-up can present ten times more contact area simply because its bubbles are smaller. That is why two systems with identical flow rates and identical pressure drops can deliver wildly different transfer efficiency.
Breakup and coalescence continuously reshape the distribution along the flow path. A distribution measured at the inlet of a sparger is rarely the distribution that reaches the impeller, the membrane or the reaction zone. Engineering the invisible starts with measuring what is actually there.
Define the metric before you pick the instrument
Measurement disputes are usually definition disputes. Agree the following before anyone opens a probe:
- Which distribution? A number distribution and a volume distribution tell different stories; the same population can peak at very different diameters depending on how you weight it.
- Which mean? For transfer and reaction work, the Sauter mean diameter (d32) is usually the meaningful figure because it tracks surface area per unit volume. For separation and flotation, a volume-weighted percentile may matter more.
- Which moments? Number density, d10, d32 and d90 together describe the shape of the population. Reporting only an average hides the tail that often controls performance.
- Where and when? Local measurements near the wall, the sparger or the impeller face differ from a line-average across the pipe. State the location, the operating point and the sampling window.
Match the technique to your flow regime
No single method is best across every regime. The right choice depends on opacity, bubble concentration, scale and whether you can tolerate intrusion.
Invasive probes
Needle, capillary and fibre-optic probes resolve local bubble chord lengths at high temporal resolution. They cope well with dense, opaque dispersions where optical access is impossible, and they are compact enough for plant-scale hardware. Their limitations are equally clear: they intrude on the flow, they measure chords rather than true diameters, and they demand careful statistical correction to recover a distribution. In high-velocity or coalescence-sensitive systems, the probe can change the very population it is measuring.
High-speed imaging
High-speed cameras capture the full field, giving direct visual evidence of bubble shape, deformation and breakup that point methods cannot. Modern setups resolve individual bubbles across a range of sizes and provide an intuitive record that reviewers trust. The constraints are optical access, depth of field, and the volume of data a long run generates. Thresholds, overlaps and out-of-focus bubbles all need disciplined processing to avoid bias.
AI-powered characterisation
Where classical thresholding struggles – overlapping bubbles, deformed interfaces, dense dispersions, awkward lighting – trained imaging models separate and size individual bubbles far more reliably. AI-powered characterisation extends high-speed imaging beyond the easy cases, recovering distributions in conditions that would previously have been rejected as unmeasurable. It is the difference between a technique that works in a clean bench cell and one that works on the real stream.
In practice, the strongest studies pair methods: a probe for temporal coverage, imaging for shape and validation. Where techniques disagree, the disagreement is itself data – it usually points to a definition or calibration issue worth resolving.
A workflow you can defend
Measure, Model, Develop, Validate. Run the loop deliberately:
- Measure. Fix the operating window, the measurement location and the sampling duration up front, then capture with a method matched to the regime.
- Model. Reconcile the measured distribution with your CFD or population-balance model. Where they diverge, the gap is the finding.
- Develop. Adjust the design – sparger geometry, mixer energy input, downstream conditioning – and predict the new distribution.
- Validate. Re-measure under the same conditions and confirm the change did what the model claimed.
This loop converts a set of numbers into evidence. Each pass tightens the model and shrinks the assumptions your team has to carry into the next project.
Turning distributions into decisions
Once the distribution is measured and reconciled, it becomes an engineering lever:
- Scale-up. Preserve the d32 and the distribution shape, not just the superficial velocity, and transfer performance follows.
- Mass transfer. Size the interfacial area from the measured second moment rather than a handbook average.
- Separation and flotation. Use the coarse tail to set residence time and the fine fraction to set chemistry.
- Troubleshooting. A shift in distribution often explains a fall in yield long before a sensor flags a fault.
Measure, then design with confidence
Bubble size distribution is measurable, and measurement is cheaper than the consequences of guessing. Build the method around the decision you need to make, pick the technique that survives your real operating conditions, and validate the result. That is how plants get answers built on what can be proved, not what can be promised.
If your process depends on getting bubble and droplet behaviour right, talk to an engineer at Innovexis. Our characterisation, CFD and AI-powered imaging work exists to turn an invisible population into a number your team can defend – at bench scale, pilot scale and on the plant.