
Bubble and Droplet Characterisation: A Practical Guide
Why bubble and droplet size, shape and distribution drive process performance Measuring what the eye cannot see: imaging, sampling and data capture basics From raw measurements to actionable insight with AI-powered imaging
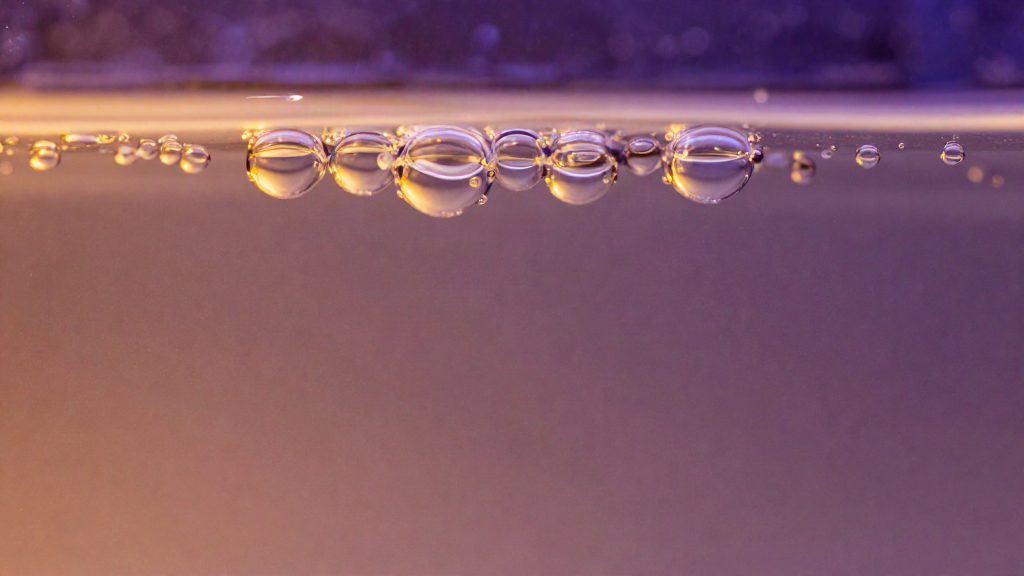
Bubbles and droplets are the hidden actors in most industrial processes. They decide how fast a reaction runs, how much oxygen reaches a fish stock, how clean a separation stage is and how efficiently heat moves through a column. Yet on a busy plant they are effectively invisible. You see a froth, a plume or a haze of fine droplets, but not the numbers that govern performance.
This guide is a practical starting point for plant operators and process engineers who want to understand bubble and droplet characterisation before committing to a project. We will cover why size, shape and distribution matter, how to measure what the eye cannot see, and how AI-powered imaging turns raw frames into decisions you can defend.
Why bubble and droplet size, shape and distribution drive process performance
Bubble and droplet characterisation is the measurement of the individual elements of a dispersed phase: how big they are, what shape they take, and how that population is distributed. Those three properties drive almost everything downstream.
Size sets the physics. Smaller bubbles mean more surface area per unit of gas volume, which lifts mass transfer in aeration, fermentation and flotation. Smaller droplets in an emulsion improve stability and reaction kinetics. But go too small and you can create foaming, carryover or energy penalties that erode the gain.
Shape tells you about the environment the element is moving through. A clean sphere suggests stable interfacial tension and low shear. A stretched, wobbling or coalescing bubble is a signal that you are near a regime change, that a pump is degrading the dispersion, or that a surfactant has shifted the balance.
Distribution is where averages mislead. A mean diameter can look perfectly healthy while a long tail of oversized bubbles quietly drags down performance. Operators who track the full distribution catch drift early, before it shows up as off-spec product or rising energy cost.
The message is simple: if you cannot characterise the population, you are guessing. And in fluid, particle and bubble problems, guessing gets expensive.
Measuring what the eye cannot see: imaging, sampling and data capture basics
Getting reliable numbers starts with three practical questions: where do you measure, how do you see it, and how do you turn what you see into data.
Sampling that represents the process
A measurement is only as good as the sample it is taken from. Decide early whether you need an in-line view of the real stream or a controlled sample drawn off for closer inspection. Consider pressure, temperature, and how the act of sampling itself distorts the dispersion. Pull a sample too aggressively and you shred the very bubbles you meant to measure. The goal is a window that reflects the process, not an idealised version of it.
Imaging: making the invisible visible
Imaging is the workhorse of characterisation. A well-lit field of view, a known measurement scale and a clean optical path let you capture individual bubbles and droplets with the resolution their size demands. Backlighting is your friend for shadow-based sizing; diffuse front lighting helps when you need to see shape and deformation. Depth of field matters, because a bubble out of focus is a bubble measured wrong.
Data capture: from frames to numbers
Once you can see the population, you need to count it consistently. Good data capture means a stable frame rate, a defined field of view, and a repeatable way to isolate each element from its background. This is where many manual approaches stall: a human annotating hundreds of frames is slow, subjective and impossible to audit. Automated capture turns minutes of footage into thousands of measured elements, each with a size, a shape and a position.
Understand the basics and you have removed most of the guesswork before a single number is reported.
From raw measurements to actionable insight with AI-powered imaging
Raw frames are not insight. Turning them into something you can act on is the step that separates a demonstration from a decision.
AI-powered imaging does the heavy lifting. Trained models detect and segment overlapping bubbles and droplets that would defeat a simple threshold, handle variable lighting and reject the out-of-focus artefacts that corrupt manual counts. The output is a defensible measurement of the whole population: size distributions, shape statistics and the trends that sit behind them.
That changes the conversation on the plant. Instead of “the froth looks a bit different today”, you can say the median bubble size has drifted 15 per cent over the shift, and point to the pump or the dosing rate that moved with it. Characterisation stops being a one-off study and becomes a monitored variable you can trend, alarm on and optimise against.
We pair high-speed and inline imaging with validated analysis pipelines so the numbers hold up to scrutiny. We measure, we model, and then we validate against the process, because a measurement that cannot be trusted is worse than none at all.
Where to start on your own plant
Begin with one problem that costs you money today: a transfer stage that underperforms, an aeration basin that never quite hits its target, a separation that is inconsistent shift to shift. Define the measurement window, capture a baseline, and let the distribution tell you where the leverage is.
Characterisation is not a black box. It is a sequence of disciplined steps, and each one you take removes guesswork you were paying for. Measure, model, develop, validate. That is how you engineer the invisible, and it is how we build results on what we can prove, not what we can promise.
If you want a rigorous, measurable answer to a fluid, particle or bubble problem, TALK TO AN ENGINEER.